Wednesday, July 2, 2014

Watching the OCO-2 launch

Hey,

today everything went smoothly.


Watching the launch from NASA TV 
Ciao,
Janne


Tuesday, July 1, 2014

OCO-2 launch delayed

Hello,

today at our FMI office we were gathered to watch the launch of OCO-2 from NASA TV. This was actually the second time, since the launch of the first version failed in 2009. Just 46 seconds before the launch, a failure in the launch pad water flow was found. Not cool.

Now we have to just wait and see what happens next.

See "Five Things about OCO-2" to learn more this instrument.
OCO-2 is NASA’s first mission dedicated to studying atmospheric carbon dioxide, the leading human-produced greenhouse gas driving changes in Earth’s climate.
 Also BBC article "Nasa satellite to seek 'missing carbon'" is interesting:
The $468m (£275m) OCO-2 mission is going to trace the global geographic distribution of carbon dioxide in the atmosphere - to try to identify precisely where it is emitted and absorbed. 
Cheers,

Janne

Update:
The launch of NASA’s Orbiting Carbon Observatory-2 (OCO-2) aboard a United Launch Alliance Delta II rocket is scheduled for Wednesday, July 2 at 5:56 a.m. EDT (2:56 a.m. PDT) from Space Launch Complex 2 at Vandenberg Air Force Base in California.
See it live: http://www.nasa.gov/multimedia/nasatv/

Friday, May 16, 2014

Pandora spectrometer at FMI's roof

Hello,

Yesterday I got a rare opportunity to do some "real work" when we went to assembly our new Pandora instrument on top of the FMI roof. My work was mainly to be cool on photograps... Anyway, Pandora is a ground-based spectrometer that observes ozone and NO2 among other things. Maybe I will blog more about these observations in the future, if something interesting happens. Now I just wanted to share some photos...

Ciao,

Janne

Me (center) and Niilo (left) being prepared to watch Jari to do the actual work.

Panorama from the FMI's roof.

The Pandora spectrometer is inside that black box.

The Pandora head sensor et al.

Yay, we got a radiance!

Friday, April 25, 2014

SAGE III on ISS

Hello,

I found an interesting video today that I wanted to share with you guys. Here it is


As we write on our NO3 paper
SAGE III continued the heritage of SAGE I (1979–1981) and SAGE II (1984–2005) by measuring ozone, nitrogen dioxide, water vapor, and aerosol extinctions by solar occultation technique and additionally performed new nocturnal measurements of ozone, NO2, and NO3 using lunar occultation technique. SAGE III was launched 10 December 2001 on board a Russian Meteor-3M spacecraft, and it recorded data between 7 May 2002–26 October 2005 in lunar occultation mode ... A copy of the SAGE III instrument will be deployed on the International Space Station (ISS) in 2014. It will continue to record data in the lunar occultation mode, and hence it will provide NO3 vertical profiles.
The launch of SAGE III on ISS is currently scheduled to be 400 days from now, so in March 2015. You can find more information from this website.

Cheers,

Janne

Monday, February 10, 2014

The pseudo-marginal approach to “exact approximate” MCMC algorithms

Hello,

lately in my research I have been dealing with noisy likelihoods. What I have learned with my testings is that MCMC works fine, if the noise level in the likelihood is low enough, but it gets stuck, if the noise level is too high.

Now I have learned from friends and the literature that MCMC works exactly correct with these noisy likelihoods. This approach is called the pseudo-marginal MCMC and it was first introduced by Mark Beaumont. Cool.

Here I would like to advertise a neat blog by  Darren Wilkinson that explains this pseudo-marginal idea in a way that I understand it too.

Check it out!

All the  best,

Janne

Thursday, January 23, 2014

Characterization of OMI tropospheric NO2 over the Baltic Sea region

Hey all,

Iolanda’s paper ”Characterization of OMI tropospheric NO2 over the Baltic Sea region” got published in Atmospheric Chemistry and Physics Discussions. It is an interesting piece of work that is related to the earlier blogpost about the OMI  NO2 and Google Earth. The main idea of the paper is to study tropospheric NO2 from the OMI satellite instrument in the Baltic Sea region. The paper shows—among other things—that
  1. It is possible to detect shipping lanes also in the challenging Baltic Sea conditions;
  2. They are consistent with the emission modeling;
  3. It is possible to calculate NO2 emissions and lifetimes for the cities like Helsinki;
I have also a small contribution in the paper.

Citation: Ialongo, I., Hakkarainen, J., Hyttinen, N., Jalkanen, J.-P., Johansson, L., Boersma, F., Krotkov, N., and Tamminen, J.: Characterization of OMI tropospheric NO2 over the Baltic Sea region, Atmos. Chem. Phys. Discuss., 14, 2021-2042, doi:10.5194/acpd-14-2021-2014, 2014. Link to the paper.

Iolanda will also present some of this stuff plus more in the 2014 EGU General Assembly.

Cheers,
Janne

Wednesday, January 8, 2014

Otsonikerroksen toipuminen on alkanut

Moikkelis,

Ilmatieteen laitos lähtetti eilen tiedotteen, jonka mukaan ilmakehän otsonikerroksen toipuminen voidaan vahvistaa alkaneeksi. Myös Helsingin sanomat teki asiasta uutisen ja tiedote julkaistiin muutenkin laajasti.

Varsinaisen ajankohtaisesta uutisesta ei ole kuitenkaan kyse sillä toipumisen katsotaan alkaneen jo noin vuoden 1997 paikkeilla. Toisaalta myös taitekohdan jälkeen tarvitaan pitkä aikasarja analyysiä varten.
"Muissa samantyyppisissä tutkimuksissa on saatu samaan suuntaan viittaavia tuloksia. Tässä oleellista on, että pystyimme käyttämään pitkiä aikasarjoja, joiden perusteella otsonimäärän kääntyminen nousuun on todistettu", Ilmatieteen laitoksen tutkimusprofessori Erkki Kyrölä kertoo.
Uutisen pohjana olevassa tutkuksessa on ideana yhdistää amerikkalaisen SAGE II -satelliitti-instrumentin ja eurooppalaisen GOMOS-instruentin havaintodatat ja näin luoda pitkä yhtenäinen aikasarja. Kuten alla olevasta kuvasta havaitaan, niin toipuminen on varsin maltillista verratuna aikaisempaan vähenemiseen.
An example of the fit at 40 km between 40–50 N for the combined SAGE II–GOMOS monthly data. The data points are black circles. The inflection year is 1997. The red solid curve and red line line represent the fit and linear trend for 1984–1997, respectively. The blue solid curve and blue line represent the fit and linear trend for 1997–2011, respectively.

Otsonin toipuminen johtuu yleisesti Montreallin pöytäkirjasta, jolla pyritään otsonikerroksen suojeluun vähentämällä otsonikatoa aiheuttavien aineiden (CFC-kaasujen) vaikutusta ja käyttöä. Montrealin pöytäkirjaa on luonnehdittu yhdeksi onnistuneimmista kansainvälisistä ympäristösopimuksista. Se on ainoa aidosti globaali ympäristösopimus. Tämä siis Wikipedian mukaan.

Itse tutkimus on julkaistu kansainvälisessä Atmospheric Chemistry and Physics -tiedelehdessä.

Tutkimus: Kyrölä, E., Laine, M., Sofieva, V., Tamminen, J., Päivärinta, S.-M., Tukiainen, S., Zawodny, J., and Thomason, L.: Combined SAGE II–GOMOS ozone profile data set for 1984–2011 and trend analysis of the vertical distribution of ozone, Atmos. Chem. Phys., 13, 10645-10658, doi:10.5194/acp-13-10645-2013, 2013.

Kannattaa katsoa myös: Laine, M., Latva-Pukkila, N., and Kyrölä, E.: Analyzing time varying trends in stratospheric ozone time series using state space approach, Atmos. Chem. Phys. Discuss., 13, 20503-20530, doi:10.5194/acpd-13-20503-2013, 2013.

Otsoniterveisin,
Janne

***
Huomasin juuri, että Erkkiä oli haastateltu eilen myös MTV:n Kymmenen uutisissa ja tänään hän on Ylen Aamu-tv:ssä. Onnea!

Wednesday, December 11, 2013

OMI tropospheric NO2 over Northern Europe

Hey all,

check out this beautiful thing that Iolanda created:


View Larger Map

Cool. See also explanations and more from this link.

Baci baci,
Janne

Sunday, December 1, 2013

PhD defense

Hello,

I don't know what happened, but here are some photos...

Soon-to-be Dr. Janne J. Hakkarainen

Interesting...

...time to sleep.

Saturday, November 9, 2013

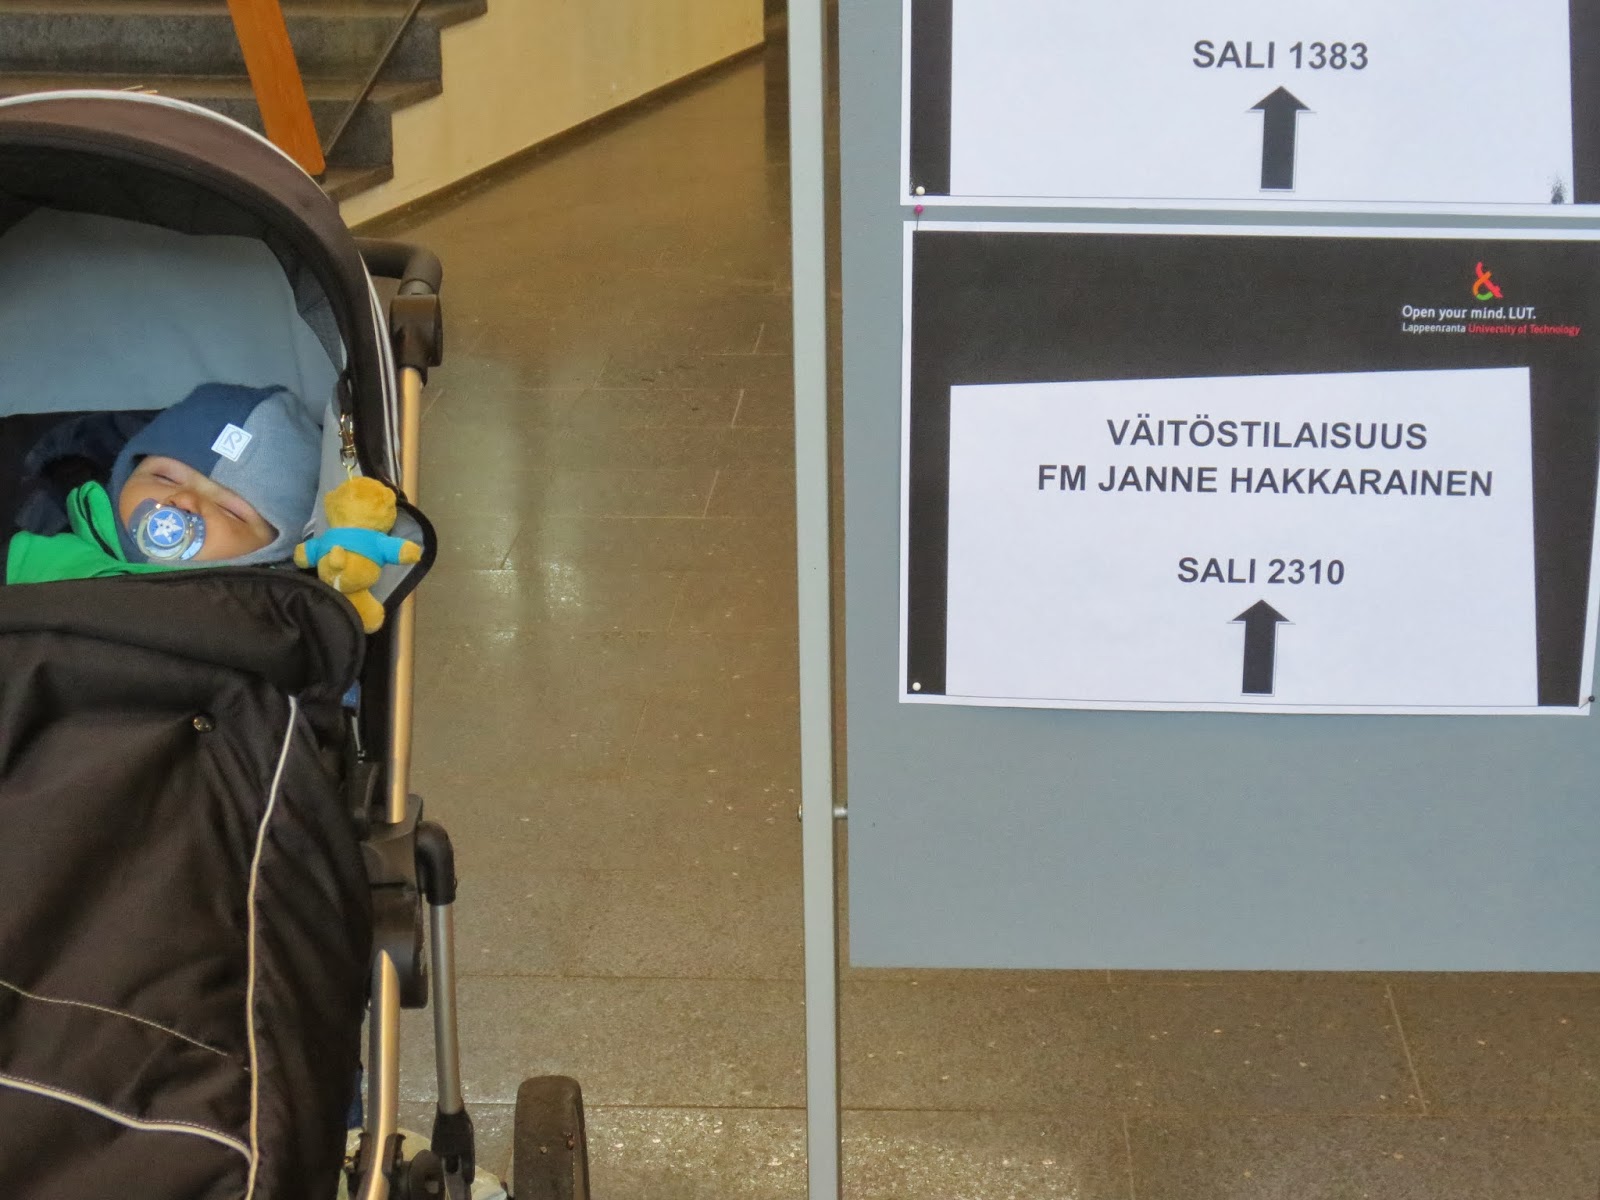
Väitös ja kirja

Hey all,

I will have my PhD defense at Lappeenranta University of Technology on the 22nd of November, 2013, at 2 pm. Cool. Grrrr. The väitöskirja arrived via mail. Feels good.

Updates:
  1. The defense got postponed and will be on the 29th of November.
  2. You can download the electronic version of the dissertation from http://urn.fi/URN:ISBN:978-952-265-500-4
All the best,
Janne

My dissertation on a table:


Saturday, October 12, 2013

SPIE Remote Sensing 2013

Hello,

I went to Dresden to participate on SPIE Remote Sensing 2013 conference. Here's a photo of myself having a presentation on GOMOS one-step retrieval algorithm.

Me having a presentation. Thanks Anu for the photo!
The conference proceedings will be available here and the estimated publishing date is 7 November 2013. Unfortunately I missed my colleague's—Anu's (sic)—presentation, but gladly it is now available on AMTD.  For me the conference wasn't exactly what I was after, but that's life and what I've heard "usual feeling". Dresden was okey, not Deutsche Demokratische Republik in my mind. Now I'm on paternal leave, which is great!

Janne

Wednesday, September 11, 2013

Sää- ja ilmastomallien parametrien yksikäsitteisyyteen liittyy dilemma

Moikka,

Ilmatieteen laitos julkaisi tänään varsinaisilla nettisivuillaan tiedeuutisen mun dilemmapaperista. Uutinen on jo tosin kirjoitettu toukokuussa IL:n sisäisiä sivuja varten. Tässä linkki tiedeuutiseen:

Sää- ja ilmastomallien parametrien yksikäsitteisyyteen liittyy dilemma

Janne

P.s. otin tekstin myös tänne:
Sää- ja ilmastomallien parametrien yksikäsitteisyyteen liittyy dilemma 
Ilmatieteen laitoksen tutkijat ovat löytäneet dilemman liittyen kaoottisten mallien parametrien yksikäsitteisyyteen. Dilemma syntyy, kun ennustemalleissa käytettyjen suotimien ominaisuuksia muutetaan. 
Perinteisesti on ajateltu, että säätä ja ilmastoa ennustavien mallien parametrit täytyy uudelleen säätää vain, jos mallin olennaisia ominaisuuksia muutetaan. Tehty tutkimus kuitenkin osoittaa, että uudelleensäätö on tarpeen myös niin sanottua data-assimilaatiokomponenttia muutettaessa.
"Todellisuuksia voi olla vain yksi, mutta optimaalisia arvoja voi olla useita riippuen suotimien ominaisuuksista", tutkimusta vetänyt Janne Hakkarainen selittää. "Nyt ollaan tekemisissä mallien sisuskalujen kanssa", hän jatkaa. 
Tehty tutkimus ei ole puhtaasti akateeminen vaan sillä on myös suoria käytännön sovelluksia.
Ilmatieteen laitoksen tutkijat löysivät dilemman käyttäen standardia Lorenz95-testimallia. "Dilemma on nyt näytetty toteen pikkumallilla. Seuraavaksi on ilmastomallin vuoro", Hakkarainen kertoo. Ajot ovatkin jo käynnissä ja alustavia tuloksia on saatu. 
Tutkimus on julkaistu kansainvälisessä Tellus A-tiedelehdessä ja siihen on osallistunut tutkijoita Ilmatieteen laitokselta, Aalto-yliopistolta, Helsingin yliopistolta ja Lappeenrannan teknilliseltä yliopistolta. Tutkimus on tehty osana Suomen akatemian laskennallisten tieteiden tutkimusohjelmaan kuuluvaa NOVAC-projektia, jonka tarkoituksena on tutkia ilmastomalleihin liittyvien parametrien epävarmuutta. 
Lisätiedot:
Tutkija Janne Hakkarainen, puh. 045 124 0257, janne.hakkarainen@fmi.fi
Linkki tutkimukseen: http://dx.doi.org/10.3402/tellusa.v65i0.20147

Back in office

Hey,

back in office, but being a holiday maker for two weeks was fun :-) During the holiday I received my first invitation to be a referee for a paper. Hah, I get to criticize the work of others and get a revenge of all those wasted moments with comments. Grrr... heh. Of course I will be objective. Fun anyway.

Janne

P.s. While writing this short text, I accepted another invitation to be a referee...

Thursday, July 4, 2013

No rest for a PhD student

Hey guys,

it is already July and I'm still not headed for vacations... poor me. That is because I'm writing the introductory part of my PhD thesis. It is coming together great and the title will be
On state and parameter estimation in chaotic systems
Neat. I like the title. In addition, I have promised to write a proceedings paper about GOMOS onestep algorithm for SPIE Remote sensing conference. You can read the abstract here.

So, quite a busy summer for me. And no time for actual research. Huh.

Gladly, I have booked a trip to Italy with Iolanda and Masa. That will be right after Ferragosto. In October-November I will be have a six-week paternal month at home with Masa. I'm looking forward of it.

That all for now. Have a nice summer!

Cheers,

Janne

Monday, June 24, 2013

Modeling key processes causing climate change and variability

Hey,

check out Svante's PhD thesis "Modeling key processes causing climate change and variability" from http://urn.fi/URN:ISBN:978-951-697-784-6

Two of my publications got cited. Yeah :-)

Janne

Thursday, June 6, 2013

Superstorm Sandy - OpenIFS WS

Hey,

in the practical session of the OpenIFS user meeting, as an case study we had the "Superstorm Sandy". Here is "our" simulation of Sandy hitting New York.

Janne

Tuesday, June 4, 2013

OpenIFS

Hey,

this week I will spent studying the OpenIFS model in "OpenIFS user workshop". OpenIFS is a stripped version, e.g. no data assimilation, of the ECMWF's IFS forecast model. I am not an expert yet, but maybe I will learn more in the practical sessions. Here you can find a little presentation of the model from EGU 2013 meeting: http://meetingorganizer.copernicus.org/EGU2013/orals/12394

See also the presentation "A novel approach for tuning ensemble prediction systems" put together by Antti Solonen and Heikki Järvinen.

Janne


Friday, May 24, 2013

Paranormal distribution

Hey,

I found a funny picture today...

Janne

Friday, May 3, 2013

A dilemma of the uniqueness of weather and climate model closure parameters

Our latest paper "A dilemma of the uniqueness of weather and climate model closure parameters" just got published online. It's a little continuation of our previous paper: "On closure parameter estimation in chaotic systems".

Unfortunately, I don't have time to blog more about this right now, but I will get back to this after my spring holiday...

Ciao,

Janne

Friday, April 5, 2013

The Code: "prediction"

Hey all,

I saw an interesting BBC document from Finnish TV today or actually part III of it. If you are located in Finland you can see it from Yle areena until 4.5.2013. Here is its Wikipedia page.

The document popularizes mathematics. Among other things, it deals with chaotic systems related to, e.g., numerical weather prediction.

The document features Marcus du Sautoy who is also the author of the marvelous book The Music of the Primes. Here's a little preview:


Janne

Sunday, March 24, 2013

Masa & Nasa

Hey all,

This is my son "Masa":


Thanks Mrs. Andersson!

Janne

Saturday, February 23, 2013

Giovanni

Hey,

did you know that besides an Italian name Giovanni is also a handy tool for visualizing the satellite data. Here are two example plots that I managed to do with a couple of mouse clicks.

Figure illustrates global NO2 field as seen by Dutch-Finnish OMI satellite instrument. See different features in emissions.

This animation illustrates the so-called aerosol boomerang, from Australian bushfires in December 2006.

So Giovanni it is. Try it out, it's easy to use! You can find it here: http://disc.sci.gsfc.nasa.gov/giovanni

Janne

Monday, February 18, 2013

Hypnotized, but that's alright...

Hola guys,

Hypnotized, but that's alright...


Source: This is so cool. - Imgur

Janne

Sunday, January 6, 2013

Lux Helsinki 2013


I went to see Lux Helsinki with Iolanda and now I am testing if I can add a video to the weblog. Yes, it's easy :-)

See also Iolanda's post with more videos, photos and text.

Janne

Saturday, January 5, 2013

MCMC toolbox for Matlab


Happy New Year 2013!

I would like to start the year by advertising a very nice toolbox put together by my colleague Marko Laine.

The toolbox is really handy and I've used it in all my recent works. You can download the toolbox from Marko's webite:

http://helios.fmi.fi/~lainema/mcmc/

If you don't yet know what MCMC is, I recommend starting with the following Wikipedia articles:

http://en.wikipedia.org/wiki/Markov_chain_Monte_Carlo
http://en.wikipedia.org/wiki/Metropolis%E2%80%93Hastings_algorithm

Janne

Thursday, December 20, 2012

Earth Observation Program Award 2012

Yei,

just got our Earth Observation Unit's Program Award. Feels good. It's because I work with good people. Thanks!

Janne

Tuesday, December 18, 2012

One picture tells more than a thousands words...

Hey, related to the previous post. Today, NASA's Earth Observatory website published a very powerful image acquired by VIIRS/Suomi NPP.


By looking the difference between North and South Korea you can tell the difference between the Republic and the Democratic People's Republic. Or as the Earth Observatory puts it
City lights at night are a fairly reliable indicator of where people live. But this isn’t always the case, and the Korean Peninsula shows why. As of July 2012, South Korea’s population was estimated at roughly 49 million people, and North Korea’s population was estimated at about half that number. But where South Korea is gleaming with city lights, North Korea has hardly any lights at all—just a faint glimmer around Pyongyang.
Finally, a little joke for the readers who can understand Finnish
Täällä Radio Jerevan. Kysykää meiltä mitä te haluatte, me vastaamme teille mitä me haluamme.
• Meiltä kysytään:
Mitä eroa on demokratialla ja kansandemokratialla?
• Me vastaamme:
Sama kuin paidalla ja pakkopaidalla.

Janne

Wednesday, December 12, 2012

Powerful images


Yesterday I heard an interesting talk by TROPOMI PI Pepijn Veefkind. During the talk he shared his emotions about the firsts TOMS total ozone images of Antarctic ozone depletion, that were published when he was 16 years old. The images of the ozone hole revealed quit accurately what was going on and you didn't need to be a scientist to understand them. Similarly, he pointed out, that the OMI NO2 images reveal the "true" pollution situation, e.g., in Europe, China and Eastern United States. And, even if governments don't like the fact, satellites  provide quite objective view about it.

That got me thinking how the Earth observation from space has changed the view we see our planet. One could ask, what was our picture about the Earth before satellites. And how did the first "blue marble" images of Earth changed it? How have the night-time images changed our knowledge? And what else have we learned from the satellite images?

I know, that illustrating the data is not always objective. And often the data are illustrated so that it supports the story. Often this is justified, sometimes maybe not. Anyway, to see more powerful images I recommend NASA's Earth Observatory site. Especially, its "Image of the day"-section.

A powerful image can be found anywhere. Do yourself a favor and go find the originals.

Janne

Thursday, November 22, 2012

FLDART

Hey,

submitted a paper today. It has a fancy title
A dilemma of the uniqueness of weather and climate model closure parameters
 Janne

Monday, October 15, 2012

Smoke rings from volcanos

Hey,

today I learned something cool. Under some special circumstances volcanos can do smoke  rings. Apparently it's very rare and still a mystery to the volcanologists. Here's a figure from Eyjafjallajökull volcanic eruption:


And here's a figure from Etna:


Link: http://news.discovery.com/earth/iceland-volcano-smoke-ring.html
Link: http://news.bbc.co.uk/2/hi/science/nature/696953.stm

Janne

P.s. I can do the same thing with my mouth...