Friday, September 22, 2023

Satellites capture socioeconomic disruptions during the 2022 full-scale war in Ukraine


Satellite observations show significantly reduced air pollution levels over the major Ukrainian cities, power plants and industrial areas.

Since February 2022, the full-scale war in Ukraine has been strongly affecting society and economy in Ukraine. Satellite observations provide crucial information to objectively monitor and assess the impacts of the war. A new paper published today on Scientific Reports utilizes satellite observations of air pollutants and other relevant parameters from multiple platforms to assess the impacts of the ongoing war on the Ukrainian society. Satellite observations show that the concentrations of nitrogen dioxide (NO₂), which is emitted through fossil fuel combustion processes, declined in 2022 over the major Ukrainian cities, power plants and industrial areas by 15–46%.

Such reductions reflect the decrease in population and corresponding emissions from the transport and commercial or residential sectors as well as the decline in industrial production, especially from the metallurgic and chemical industry, which led to a reduction in power demand and corresponding electricity production from power plants. Carbon dioxide (CO₂) observations also indicate reductions in fossil fuel combustion, especially in eastern Ukraine, where the largest emission sources are located.

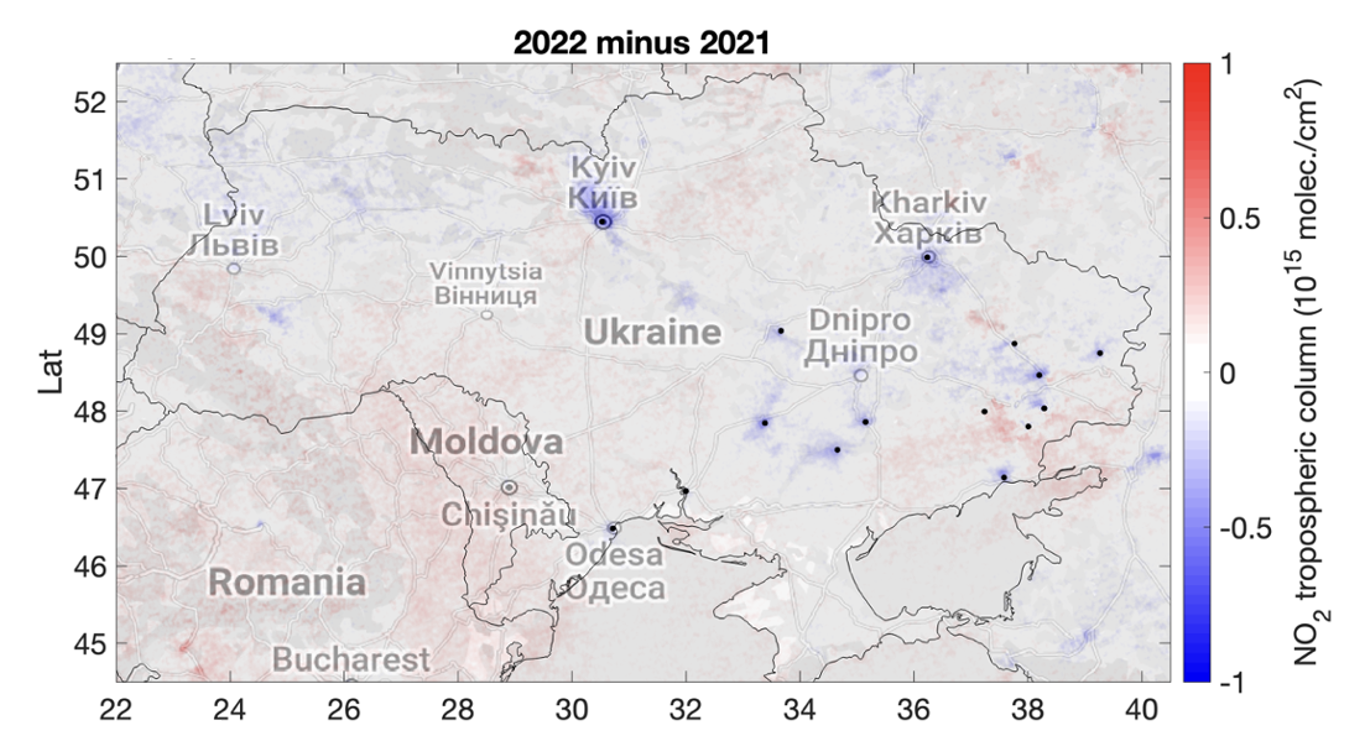
Difference of the March-August mean tropospheric NO2 columns between 2022 and 2021 based on S5P/TROPOMI observations. Blue colors indicate reductions observed in 2022. Black dots correspond to the major cities, industrial areas and power plants.


“During peaceful times, reductions in nitrogen dioxide concentrations as those observed here would be considered as a welcome improvement of air quality and human health. In this case, the observed changes tell a different story about the extent of the disruption caused by the war on the Ukrainian society and economy. Also, the reductions in fossil fuel consumption in Ukraine might have been partly offset by an increase elsewhere”, explains senior researcher at the Finnish Meteorological Institute Iolanda Ialongo, who led the work.

Exceptional fire patterns near the front line  

Satellite imagery and fire detections indicate an anomalous distribution of fires along the front line, which are attributable to shelling or other war-related fires, rather than the typical homogeneously distributed fires related to crop harvesting. Satellite imagery data also show drastic changes over the city of Mariupol, which was attacked during the first three months of the war.

The signal from the hot smokes from the metallurgic industrial facilities in the city disappears from the satellite imagery after March 2022, which suggest an interruption of industrial activities, and, correspondingly, NO₂ levels decreased.

The results are based on the NO₂ retrievals from the European TROPOMI (TROPOspheric Monitoring Instrument), onboard the Sentinel 5 Precursor satellite, and the CO₂ observations from the NASA’s OCO-2 satellite. Also satellite imagery from the Sentinel 2 satellite was analyzed as well as fire detectionsfrom the Visible Infrared Imaging Radiometer Suite (VIIRS).

The research was carried on at the Finnish Meteorological Institute together with colleagues from the University of Lviv (Ukraine) and USRA (USA). The Finnish part of the research was supported by the Ministry for Foreign Affairs of Finland via theInterinstitutional Development Cooperation Instrument (ICI), UHMC-FMI Meteorology project and the Research Council of Finland.

Reference: Ialongo, I., Bun, R., Hakkarainen, J. et al. Satellites capture socioeconomic disruptions during the 2022 full-scale war in Ukraine. Sci Rep 13, 14954 (2023). https://doi.org/10.1038/s41598-023-42118-w

Sunday, September 17, 2023

Two weeks in China

Hello,

some while a go me and my buddy Prof. Dongxu Yang got a joint Finland-China cooperation project together. He got the money from the Chinese Academy of Sciences (CAS) to travel to Finland and I got the money from the Research council of Finland to travel to China.

During the COVID-19 it was difficult to travel. But finally, after a long wait, I got to travel to China in September 2023. The travel plan was quite simple: The first week I would be visiting Dongxu at the Institute of Atmospheric Physics (IAP), CAS, and the second one we would be in the ESA-MOST DRAGON symposium in Inner Mongolia.

The first week was full of interesting discussions with many different people. For example, I got to see the drone equipment and we had discussions how they are planning to estimate CO2 emissions from power plants and validate satellite-based results. They plan to use cross-sectional flux methods, as I have done in my own research. I was happy to see that they use sensors from the Finnish Vaisala company.


I also got to speak about my work on the IAP seminar. After the seminar, I had some nice discussion about my work with Kai Wu who has previously worked on MicroCarb project at the University of Edinburgh. Actually, surprisingly many of the people I met, have worked there. At IAP they have many seminars. On the same day that I gave my seminar presentation, we went to see some AI/ML seminar by some famous Chinese scientist. The seminar was in Chinese, so I couldn’t follow much even though the slides were in English.


The week was also full of interesting dinners with interesting people and some sightseeing of course. I also got the visit the Earth Lab with Dongxu. During my visit the institute also had its 95th birthday and during weekend they had big celebration at the Earth Lab.


On Sunday evening me, Dongxu and Prof. Liu traveled together on a high-speed train to Inner Mongolia’s capital Hohhot where the DRAGON symposium takes place. The train stations in China seem like airports and trains like airplanes. In general, on a technological level, it seems that Chinese people are ahead of Europeans. For example, everything is paid and done on a mobile app.

On Monday, Prof. Liu organized a Workshop on China-EU GHGs measurement from Space. I also got to present my work and we had discussions on co-operations between European Copernicus CO2M and China’s TanSat-2 missions.


Tuesday marked the official opening of the DRAGON Symposium and the symposium started with some traditional Inner Mongolian music. During the poster session I had interesting discussions with Qiangian Zhang, who has done similar work that I have. I also presented a paper poster.

Wednesday was our DRAGON project main day, and Prof. Liu presented the project very well. We also prepared a summary slide of our work that Ronald van der A presented at the final session summaries. Our recommendations to ESA and MOST were:
  1. High-level co-operation between TanSat-2 and Copernicus CO2M missions to be organized by ESA and MOST
  2. TanSat-2 to be included as an ESA Third Party Mission


On Friday afternoon I took a train back to Beijing with a fantastic duo from IAP/CAS: Lu Yao and Yuli Zhang. After the train arrived at Beijing, they were kind enough to put me in taxi on towards the airport hotel. On Saturday morning I started my journey back to Europe and on Sunday at 1:30 a.m. I arrived home. Then I rested.

Thank you!

Janne

Tuesday, February 21, 2023

Building a Bridge: Estimating Carbon Dioxide Emissions Using Satellites

Building a Bridge: Estimating Carbon Dioxide Emissions Using Satellites


A team of researchers estimated the carbon dioxide (CO2) emissions from coal-fired power plants and other major anthropogenic point sources in the South African Highveld region using space-based data. The results indicate that the CO2 emissions can be obtained also in challenging cases where the plumes from multiple sources overlap.


The new publication characterizes CO2 emissions using data from NASA’s Orbiting Carbon Observatory-3 (OCO-3) and European Copernicus Sentinel-5P/TROPOMI.


The article analyses the emissions of six power stations (Kendal, Kriel, Matla, Majuba, Tutuka and Grootvlei) and the largest single emitter of greenhouse gas in the world, Secunda CTL synthetic fuel plant. The annual CO₂ emissions of the Secunda CTL exceed the emissions of several European countries, including Finland, Norway, and Portugal. 


Overall, the space-based emission estimates are in good agreement with the emission inventories. Thus, satellite observations can be used for CO2 emission estimation and are particularly useful when no other information is available.


Orbiting Carbon Observatory-3 mission operates on the International Space Station (ISS). To support the quantification and monitoring of anthropogenic CO₂ emissions, OCO-3 incorporates a new key capability that provides observations in Snapshot Area Maps (SAMs), providing contiguous images over regions as large as 80 km by 80 km in two minutes. Altogether the article analyzes six OCO-3 SAMs jointly with Sentinel-5P/TROPOMI nitrogen dioxide (NO2) columns.


Sentinel-5P/TROPOMI NO₂ and OCO-3 XCO₂ SAM observations on 21 January 2022.

The new article is a continuation of the previous work where the authors studied the emissions and NOx-to-CO₂ emission ratio of the isolated Matimba power station. The article extends the method to challenging cases where CO₂ plumes from multiple sources overlap.


The applicability of similar emission estimation approaches for future satellite missions such as the Copernicus Carbon Dioxide Monitoring mission CO2M are discussed. CO2M is Copernicus Sentinel Expansion missions and will focus on carbon dioxide released into the atmosphere specifically through human activity.


The research was carried on at Finnish Meteorological Institute together with colleagues from USRA, Colorado State University and Caltech/JPL. The Finnish part of the research was supported by European Space Agency (DACES), Academy of Finland (CitySpot, CoE inverse and ACCC) and EU-H2020 CoCO2.


The full publication by Hakkarainen and co-authors can be found at the following link: https://doi.org/10.1088/1748-9326/acb837