Magic squares have interested (recreational) mathematicians for hundreds, if not thousands, of years. A magic square is a $n\times n$ grid filled with integers such that the sum of integers in each row, column and diagonal is equal to a magic constant $M$.
There are various ways to construct magic squares. For odd integers, probably the most famous one is the Siamese method where one also requires that the grid is filled with distinctive positive integers in the range $1, \ldots, n^2$. Below is an example when $n=5$ (Du Royaume de Siam, 1693):
\begin{equation*}
\begin{array}{|c|c|c|c|c|}
\hline
17 & 24 & 1 & 8 & 15 \\
\hline
23 & 5 & 7 & 14 & 16 \\
\hline
4 & 6 & 13 & 20 & 22 \\
\hline
10 & 12 & 19 & 21 & 3 \\
\hline
11 & 18 & 25 & 2 & 9 \\
\hline
\end{array}
\end{equation*}
But what would happen if the grid would be infinite?
The simplest “solution” to this problem would be setting all cells to zero
\begin{equation*}
\begin{array}{c|c|c|c|c}
\ddots & \vdots & \vdots & \vdots & \kern3mu\raise1mu{.}\kern3mu\raise6mu{.}\kern3mu\raise12mu{.}\\
\hline
\cdots & 0 & 0 & 0 & \cdots \\
\hline
\cdots & 0 & 0 & 0 & \cdots \\
\hline
\cdots & 0 & 0 & 0 & \cdots \\
\hline
\kern3mu\raise1mu{.}\kern3mu\raise6mu{.}\kern3mu\raise12mu{.} & \vdots & \vdots & \vdots & \ddots \\
\end{array}
\end{equation*}
but this is not what we are really after here. We can obtain a slightly more interesting solution by subtracting the middle value from a Siamese magic square and adding zeros elsewhere:
\begin{equation*}
\begin{array}{c|c|c|c|c|c|c|c|c}
\ddots & \vdots & \vdots & \vdots & \vdots & \vdots & \vdots & \vdots & \kern3mu\raise1mu{.}\kern3mu\raise6mu{.}\kern3mu\raise12mu{.} \\
\hline
\cdots & 0 & 0 & 0 & 0 & 0 & 0 & 0 & \cdots \\
\hline
\cdots & 0 & 4 & 11 & -12 & -5 & 2 & 0 & \cdots \\
\hline
\cdots & 0 & 10 & -8 & -6 & 1 & 3 & 0 & \cdots\\
\hline
\cdots & 0 & -9 & -7 & \mathbf{0} & 7 & 9 & 0 & \cdots\\
\hline
\cdots & 0 & -3 & -1 & 6 & 8 & -10 & 0 & \cdots \\
\hline
\cdots & 0 & -2 & 5 & 12 & -11 & -4 & 0 & \cdots\\
\hline
\cdots & 0 & 0 & 0 & 0 & 0 & 0 & 0 & \cdots \\
\hline
\kern3mu\raise1mu{.}\kern3mu\raise6mu{.}\kern3mu\raise12mu{.} & \vdots & \vdots & \vdots & \vdots & \vdots & \vdots & \vdots & \ddots
\end{array}
\end{equation*}
This procedure gives us an infinite magic square where the sum in each row, column and diagonal is equal to zero. This still does not feel quite right as the infinite square has nonzero elements only in the middle.
But what about the infinite square below?
\begin{equation}\tag{$\infty$}\label{good}
\begin{array}{c|c|c|c|c|c|c|c|c}
\ddots & \vdots & \vdots & \vdots & \vdots & \vdots & \vdots & \vdots & \kern3mu\raise1mu{.}\kern3mu\raise6mu{.}\kern3mu\raise12mu{.} \\
\hline
\cdots & \mathbf{-1} & +1 & -1 & +1 & -1 & +1 & \mathbf{-1} & \cdots \\
\hline
\cdots & +1 & \mathbf{-1} & +1 & -1 & +1 & \mathbf{-1} & +1 & \cdots \\
\hline
\cdots & -1 & +1 & \mathbf{-1} & +1 & \mathbf{-1} & +1 & -1 & \cdots \\
\hline
\cdots & +1 & -1 & +1 & \mathbf{-1} & +1 & -1 & +1 & \cdots \\
\hline
\cdots & -1 & +1 & \mathbf{-1} & +1 & \mathbf{-1} & +1 & -1 & \cdots \\
\hline
\cdots & +1 & \mathbf{-1} & +1 & -1 & +1 & \mathbf{-1} & +1 & \cdots \\
\hline
\cdots & \mathbf{-1} & +1 & -1 & +1 & -1 & +1 & \mathbf{-1} & \cdots \\
\hline
\kern3mu\raise1mu{.}\kern3mu\raise6mu{.}\kern3mu\raise12mu{.} & \vdots & \vdots & \vdots & \vdots & \vdots & \vdots & \vdots & \ddots
\end{array}
\end{equation}
It already looks quite magical with only +1 and -1 entries. But where would the series in each row, column and diagonal sum to?
One can note that up, down, left and right from each diagonal cell we have Grandi's series $\sum_{n=1}^{\infty} (-1)^{n-1} = 1-1+1-1+1-1+\ldots$ Grandi's series is Cesàro summable, with Cesàro sum $\frac{1}{2}$. One way to justify this value is to set
\begin{equation*}
S = 1-1+1-1+1-1+\ldots
\end{equation*}
and then note that $S = 1-S$, and hence $S= \frac{1}{2}$. Now one may calculate
\begin{align*}
\ldots+1-1+1-1+\ldots &= -1 + \sum_{n=0}^{\infty} (-1)^n + \sum_{n=0}^{\infty} (-1)^n \\
& = -1 + \frac{1}{2}+\frac{1}{2}=0.
\end{align*}
Thus, the series in every row and column are Cesàro summable, with Cesàro sum $0$. But what about the diagonals?
In both diagonals, after the center cell we have $-1-1-1-1-\ldots$ One can recognize this series as a specific case of the Riemann zeta function
\begin{equation*}
\zeta(s) = \sum_{n=1}^{\infty} \frac{1}{n^s}
\end{equation*}
when $s=0$. We have that $\zeta(0)=-\frac{1}{2}$, thus one may write $-1-1-1-1-\ldots = -\zeta(0)=\frac{1}{2}$. In fact, this series is related to Grandi's series via the Dirichlet eta function
\begin{equation*}
\eta(s) = \sum_{n=1}^{\infty} \frac{(-1)^{n-1}}{n^s} = (1-2^{1-s})\zeta(s).
\end{equation*}
Now when $s=0$, we have that
\begin{equation*}
1-1+1-1+\ldots = \eta(0)=-\zeta(0) = -1-1-1-1-\ldots
\end{equation*}
The diagonals are
\begin{align*}
\ldots-1-1-1-1-\ldots &= -1- \sum_{n=1}^{\infty}\frac{1}{n^0}-\sum_{n=1}^{\infty}\frac{1}{n^0} \\
&=-1-\zeta(0)-\zeta(0)=0.
\end{align*}
Now the infinite square (\ref{good}) is indeed an infinite magic square as the series in every row, column and diagonal are equal (in above sense) to the magic constant $M=0$.
We note that by multiplying the infinite magic square (\ref{good}) with an integer $a$, we obtain another infinite magic square with $M=0$. If we set $a=-1$, we obtain the “evil twin:”
\begin{equation*}
\begin{array}{c|c|c|c|c|c|c|c|c}
\ddots & \vdots & \vdots & \vdots & \vdots & \vdots & \vdots & \vdots & \kern3mu\raise1mu{.}\kern3mu\raise6mu{.}\kern3mu\raise12mu{.} \\
\hline
\cdots & \mathbf{+1} & -1 & +1 & -1 & +1 & -1 & \mathbf{+1} & \cdots \\
\hline
\cdots & -1 & \mathbf{+1} & -1 & +1 & -1 & \mathbf{+1} & -1 & \cdots \\
\hline
\cdots & +1 & -1 & \mathbf{+1} & -1 & \mathbf{+1} & -1 & +1 & \cdots \\
\hline
\cdots & -1 & +1 & -1 & \mathbf{+1} & -1 & +1 & -1 & \cdots \\
\hline
\cdots & +1 & -1 & \mathbf{+1} & -1 & \mathbf{+1} & -1 & +1 & \cdots \\
\hline
\cdots & -1 & \mathbf{+1} & -1 & +1 & -1 & \mathbf{+1} & -1 & \cdots \\
\hline
\cdots & \mathbf{+1} & -1 & +1 & -1 & +1 & -1 & \mathbf{+1} & \cdots \\
\hline
\kern3mu\raise1mu{.}\kern3mu\raise6mu{.}\kern3mu\raise12mu{.} & \vdots & \vdots & \vdots & \vdots & \vdots & \vdots & \vdots & \ddots
\end{array}
\end{equation*}
If we square the values of the magic square (\ref{good}), we obtain an infinite square full of ones:
\begin{equation*}
\begin{array}{c|c|c|c|c}
\ddots & \vdots & \vdots & \vdots & \kern3mu\raise1mu{.}\kern3mu\raise6mu{.}\kern3mu\raise12mu{.} \\
\hline
\cdots & 1 & 1 & 1 & \cdots \\
\hline
\cdots & 1 & 1 & 1 & \cdots \\
\hline
\cdots & 1 & 1 & 1 & \cdots \\
\hline
\kern3mu\raise1mu{.}\kern3mu\raise6mu{.}\kern3mu\raise12mu{.} & \vdots & \vdots & \vdots & \ddots \\
\end{array}
\end{equation*}
In every direction we have
\begin{align*}
\ldots+1+1+1+1+\ldots &= 1+ \sum_{n=1}^{\infty}\frac{1}{n^0}+\sum_{n=1}^{\infty}\frac{1}{n^0} \\
&=1+\zeta(0)+\zeta(0)=0.
\end{align*}
Thus, it is also an infinite magic square. This new square, however, seems little bit less magical than the original one (\ref{good}).
Wednesday, August 1, 2018

Global XCO2 anomalies as seen by Orbiting Carbon Observatory-2
Dear readers,
I would like to advertise our latest work "Global XCO2 anomalies as seen by Orbiting Carbon Observatory-2." It was published yesterday as discussion paper in Atmos. Chem. Phys. Discuss. (ACPD). Here's a little preview:

Hakkarainen, J., Ialongo, I., Maksyutov, S., and Crisp, D.: Global XCO2 anomalies as seen by Orbiting Carbon Observatory-2, Atmos. Chem. Phys. Discuss., https://doi.org/10.5194/acp-2018-649, in review, 2018.
Janne
I would like to advertise our latest work "Global XCO2 anomalies as seen by Orbiting Carbon Observatory-2." It was published yesterday as discussion paper in Atmos. Chem. Phys. Discuss. (ACPD). Here's a little preview:

Hakkarainen, J., Ialongo, I., Maksyutov, S., and Crisp, D.: Global XCO2 anomalies as seen by Orbiting Carbon Observatory-2, Atmos. Chem. Phys. Discuss., https://doi.org/10.5194/acp-2018-649, in review, 2018.
Janne
Monday, April 30, 2018
Pitch like a pro!

As you might remember I was in the Skolar Award finals at Slush 2017. This week we will have a little alumni meeting organized by the Kaskas Media. The 2016 Skolar award winner Virpi Virjamo listed her 5 tips for pitching your research idea like a winner.
So here are my 5+2 tips for pitching like a pro!
1. Don’t forget your science!
I think this was the best advice that I got. Scientists tend to oversimplify when they talk about their work to non-experts. But people are smart and they will understand. If you leave your science out, what is left in your pitch!? You are not a salesman!
2. Keep it simple!
Now this second point seems to contradict what I just said in the first point. It is not. You should keep it simple, but do not oversimplify! Easy as that.
3. Practice, practice, practice!
This may sound self evident, but it is important. You should learn your pitch by heart. Be a pro. I still remember my pitch! Practicing is a good advice also to your scientific presentations. (When I gave my pitch at Slush, I made a little mistake and skipped one slide. Since I knew the pitch, I could do it on autopilot and think how to back it up in the end. It was surreal feeling).
4. Take the advice!
When people try to help you, you should listen. And make your pitch better. They will have good ideas. But remember, it is still your pitch and you have to deliver.
5. The structure! Problem, solution, vision.
This is a technical advice, but still very important. I think the structure should be a) problem, b) solution, and c) vision. So first tell what is the problem that you are solving, not the latest thing in your own research. Then give Your solution to this problem. Finally, tell how your solution will change the world.
6. Be yourself?
This is an advice that you are like to get for someone else but me. I say: Don’t be yourself, be a better version of yourself! In my daily life, I’m quite calm and low-energy guy. In a good way. In my pitch, I wanted to give 120% and be super energetic. It worked out for me.
7. Have fun!
Don’t think about $$ or the victory. It will show and you’ll regret it later. Have fun! This is a unique opportunity. Make the most of it!
Friday, January 5, 2018
2018: Centre of Excellence of Inverse Modelling and Imaging
Happy
New Year 2018!
They are plenty of new things in my academic life. I am
officially back at Finnish Meteorological Institute, now with the title “Senior
Research Scientist.” Because of the large organization change at FMI, the name
of my group is now entitled “Greenhouse Gases and Satellite Methods” in Earth
Observation Research Unit.
 |
| Centre of Excellence of Inverse Modelling and Imaging: applications. |
Probably the biggest news story is that now also our FMI team is part of the new 2018–2025 “Centre of Excellence of Inverse Modelling and Imaging.” The University of Helsinki team, the team where I had the pleasure of visiting for the last seven months, coordinates this Centre! We will have the kick-off meeting next week at Uunisaari. It will be fun!
Regarding
this site, I updated my Biographical Sketch. Enjoy!
In the next
post will recap my experiences from Slush 2017 Skolar Award.
Stay tuned!
Janne
Thursday, November 30, 2017
Slush 2017 Skolar Award Science Pitching
Hi guys!
I am very happy to say to that I am on of the ten finalists for the Skolar Award Science Pitching competition happening at Slush 2017 tomorrow! This means that I have amazing change to pitch my research idea in front of 2 000 people for three minutes! I will give everything I got!

Here’s my research idea in a nutshell:

Yesterday morning I was in the Yle morning show talking about my idea. The interview went really well, and you can watch it from Yle Areena: https://areena.yle.fi/1-4299989

Yesterday evening we had The Skolar Award Premiere at the Kaskas Media HQ. Now I should be ready!

See You at Slush Central stage tomorrow at 13:10 Finnish time. You can follow the event online at http://www.slush.org/live/#central-stage
Crazy!
Janne
I am very happy to say to that I am on of the ten finalists for the Skolar Award Science Pitching competition happening at Slush 2017 tomorrow! This means that I have amazing change to pitch my research idea in front of 2 000 people for three minutes! I will give everything I got!

Here’s my research idea in a nutshell:
As everyone should realize by now, climate change is one of the biggest threats to humanity. The main culprits are atmospheric greenhouse gases, GHGs, that increase the global temperature. This research aims to identify the main man-made areas of greenhouse gases with the help of space-based observations. Those offer a sustainable and cost-efficient tool to estimate the impact of human activities on our environment.You can meet the finalist at http://www.slush.org/news/meet-science-pitching-2017-finalists/ and https://skolaraward.fi/finalists/

Yesterday morning I was in the Yle morning show talking about my idea. The interview went really well, and you can watch it from Yle Areena: https://areena.yle.fi/1-4299989

Yesterday evening we had The Skolar Award Premiere at the Kaskas Media HQ. Now I should be ready!

See You at Slush Central stage tomorrow at 13:10 Finnish time. You can follow the event online at http://www.slush.org/live/#central-stage
Crazy!
Janne
Friday, October 13, 2017
Eye in the Sky
Dear friends,
It is my pleasure to announce that the prestigious journal Science has published a collection of five research papers based on OCO-2 data.

The main finding of this special issue was how the 2015-16 El Niño, one of the largest on record, was responsible for the record spike in carbon dioxide levels. The increase was about 3 ppm per year, while in recent years, the average annual increase has been closer to 2 ppm per year. According to Dr. Junjie Liu who led the study "about 80 percent of that amount, or 2.5 gigatons of carbon, came from natural processes occurring in tropical forests in South America, Africa and Indonesia, with each region contributing roughly the same amount."

I wasn’t part of that study, but I had a little contribution to the paper "The Orbiting Carbon Observatory-2 early science investigations of regional carbon dioxide fluxes" with XCO2 anomalies. Here’s a little video from Science Museum of Virginia explaining how the anomaly approach work:
You can find the OCO-2 special issue here: http://science.sciencemag.org/content/358/6360
Janne
It is my pleasure to announce that the prestigious journal Science has published a collection of five research papers based on OCO-2 data.

The main finding of this special issue was how the 2015-16 El Niño, one of the largest on record, was responsible for the record spike in carbon dioxide levels. The increase was about 3 ppm per year, while in recent years, the average annual increase has been closer to 2 ppm per year. According to Dr. Junjie Liu who led the study "about 80 percent of that amount, or 2.5 gigatons of carbon, came from natural processes occurring in tropical forests in South America, Africa and Indonesia, with each region contributing roughly the same amount."

I wasn’t part of that study, but I had a little contribution to the paper "The Orbiting Carbon Observatory-2 early science investigations of regional carbon dioxide fluxes" with XCO2 anomalies. Here’s a little video from Science Museum of Virginia explaining how the anomaly approach work:
You can find the OCO-2 special issue here: http://science.sciencemag.org/content/358/6360
Janne
Wednesday, June 14, 2017
IWGGMS-13
Dear readers,
Last week the 13th International Workshop on Greenhouse Gas Measurements from Space (IWGGMS) was held at the main building of the University of Helsinki. The meeting had a very good atmosphere, and with about 160 participants, I got to talk with many new and old GHG colleagues, and once again learned a lot! Here are couple of photos.
Thank you for the meeting!
Janne
Last week the 13th International Workshop on Greenhouse Gas Measurements from Space (IWGGMS) was held at the main building of the University of Helsinki. The meeting had a very good atmosphere, and with about 160 participants, I got to talk with many new and old GHG colleagues, and once again learned a lot! Here are couple of photos.
Thank you for the meeting!
Janne
 |
| Opening talk by Dr. David Crisp |
 |
| That's me presenting my work! |
 |
| Dr. Iolanda Ialongo presenting her poster |
 |
| Our PhD student Ella Kivimäki presenting her poster |
 |
| Dr. Hannakaisa Lindqvist presenting her posters |
 |
| Group photo! |
Wednesday, May 31, 2017
Back to the start

Dear
readers,
I started
my academic life in 2004 as a math student in University of Helsinki. I
enjoined my time there, although, one of the best experiences of my “university
years” was the academic year 2006/2007 that I got to spent in Roma Tre University as an Erasmus exchange student. During the later part of my studies,
in 2008, I joined the Atmospheric Remote Sensing group of the Finnish Meteorological Institute first as a summer
trainee, then as a master’s thesis worker, and finally as a research scientist.
I never looked back, and went to do my PhD studies in Lappeenranta University of Technology (2011–2013). This means that I never actually worked for my alma
mater.
Tomorrow
that is about to change, as I will join the Inverse Problems research group in the
Department of Mathematics and Statistics until the end of this year. I am excited
about this opportunity and will try to learn as much as I can during the next
seven months. Research-wise, this is also an excellent opportunity to study the different aspects of the inverse problems research.
Actually, I
will start my first full week as a university employee in the “13th InternationalWorkshop on Greenhouse Gas Measurements from Space.” Finnish Meteorological Institute organizes the meeting, but it will be held in the main building of… University
of Helsinki!
See you
there!
Janne
Saturday, December 10, 2016
Direct space-based observations of anthropogenic CO2 emission areas from OCO-2, Part II
Dear readers,
the previous blogpost was about the public outreach of our latest paper: "Direct space-based observations of anthropogenic CO2 emission areas from OCO-2."
However, the blogpost itself did not mention the scientific content of that paper at all. As I presented this work as a poster at the OCO-2 Algorithm and Science Team Meeting at NCAR Mesa Lab in Boulder, Colorado earlier this year. I would like to share the poster with you now

The meeting itself was absolutely fantastic, and I learned a lot. We also got to see a AirCore launch which was fun

Janne
the previous blogpost was about the public outreach of our latest paper: "Direct space-based observations of anthropogenic CO2 emission areas from OCO-2."
However, the blogpost itself did not mention the scientific content of that paper at all. As I presented this work as a poster at the OCO-2 Algorithm and Science Team Meeting at NCAR Mesa Lab in Boulder, Colorado earlier this year. I would like to share the poster with you now

The meeting itself was absolutely fantastic, and I learned a lot. We also got to see a AirCore launch which was fun

Janne
Direct space-based observations of anthropogenic CO2 emission areas from OCO-2
Dear readers,
it has been a while since I have blogged last time. But there has been a good reason. I have been busy with our latest work "Direct space-based observations of anthropogenic CO2 emission areas from OCO-2". In comparison to many of my previous works, the public outreach with this one has been through the roof. For example JPL/NASA published a news feature about it

The same text was also published as a press release at the front page of FMI website. It was also picked-up by many news outlets like the Daily Mail and Tähdet ja Avaruus from Finland, to name a few. One of the funniest was this newspaper clipping we got all the way from Katmandu

We made also a Finnish press release about it.
NASA EarthObservatory made new elegant figures for their image of the day feature. Those images were further included for example in this inverse.com article.
I have gotten so many emails about this work from journalist, scientist, teachers, and ordinary people alike. Literally, everyday. Two of the questions from readers of NASA EarthObservatory, with responses, were published in a follow-up.
Today also come out new Tiedelehti. There’s a "Tieteen tentti" with a familiar face
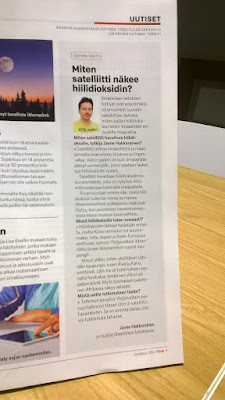
I wrote also an article, suitable for the general public, to the next Ilmansuojelu -lehti, 4/2016. It will come out later this month.
Earlier this week, I gave a guest lecture at Lappeenrant University of Technology. The XCO2 anomaly data together with OMI NO2 data were also given for the students for their study assignment related to cluster analysis.
This research has also trigged many new scientific collaborations, and there will be many new adventures. I will promise.
Stay tuned!
Janne
it has been a while since I have blogged last time. But there has been a good reason. I have been busy with our latest work "Direct space-based observations of anthropogenic CO2 emission areas from OCO-2". In comparison to many of my previous works, the public outreach with this one has been through the roof. For example JPL/NASA published a news feature about it

The same text was also published as a press release at the front page of FMI website. It was also picked-up by many news outlets like the Daily Mail and Tähdet ja Avaruus from Finland, to name a few. One of the funniest was this newspaper clipping we got all the way from Katmandu

We made also a Finnish press release about it.
NASA EarthObservatory made new elegant figures for their image of the day feature. Those images were further included for example in this inverse.com article.
I have gotten so many emails about this work from journalist, scientist, teachers, and ordinary people alike. Literally, everyday. Two of the questions from readers of NASA EarthObservatory, with responses, were published in a follow-up.
Today also come out new Tiedelehti. There’s a "Tieteen tentti" with a familiar face

I wrote also an article, suitable for the general public, to the next Ilmansuojelu -lehti, 4/2016. It will come out later this month.
Earlier this week, I gave a guest lecture at Lappeenrant University of Technology. The XCO2 anomaly data together with OMI NO2 data were also given for the students for their study assignment related to cluster analysis.
This research has also trigged many new scientific collaborations, and there will be many new adventures. I will promise.
Stay tuned!
Janne
Tuesday, August 16, 2016
Pawan K. Bhartia – the man who created the first image of the ozone hole
Hi guys,
couple of days ago, I found this very interesting Youtube video of “Pawan K. Bhartia Maniac Lecture, August 27, 2014.”
In the video P.K. talks about his career and how the discovery of the ozone hole come about. It is a very interesting story.
See also “Discovering the Ozone Hole: Q&A With Pawan Bhartia” and “Ozone Hole History.”
Oh, and this is the very first image of the ozone hole:

Very powerful image!
Janne
couple of days ago, I found this very interesting Youtube video of “Pawan K. Bhartia Maniac Lecture, August 27, 2014.”
In the video P.K. talks about his career and how the discovery of the ozone hole come about. It is a very interesting story.
See also “Discovering the Ozone Hole: Q&A With Pawan Bhartia” and “Ozone Hole History.”
Oh, and this is the very first image of the ozone hole:

Very powerful image!
Janne
Friday, May 6, 2016
CARB-ARC: Remote sensing of greenhouse gas concentrations #Arktiko
Hello,
next week I'm headed to the Academy of Finland's annual ARKTIKO seminar. Below you can find the poster I'm about to present. It summarize the remote sensing activities done in our CARB-ARC project.
Cheers,
Janne

next week I'm headed to the Academy of Finland's annual ARKTIKO seminar. Below you can find the poster I'm about to present. It summarize the remote sensing activities done in our CARB-ARC project.
Cheers,
Janne

Saturday, April 16, 2016
The Audacity of Hope: President Obama Explains How Pollution Affects Our Planet
Friday, April 1, 2016
Using OCO-2 Data to Analyze Anthropogenic CO2 Hotspots: First Preliminary Results
Hello,
just submitted the abstract below to the "12th International Workshop on Greenhouse Gas Measurements from Space." I am not going, but our boss Johanna Tamminen will present this.
Janne

just submitted the abstract below to the "12th International Workshop on Greenhouse Gas Measurements from Space." I am not going, but our boss Johanna Tamminen will present this.
Janne
Using OCO-2 Data to Analyze Anthropogenic CO2 Hotspots:First Preliminary ResultsJanne Hakkarainen (1), Iolanda Ialongo (1), and Johanna Tamminen (1)(1) Finnish Meteorological Institute (FMI)NASA’s Orbiting Carbon Observatory 2 (OCO-2) was launched on 2 July 2014 to monitor global atmospheric concentration and flux of CO2 from space. As of March 2016, the instrument has collected more than one year of data. In this paper, we utilize this data record to analyze hotspots of anthropogenic CO2 sources. Our aim is to utilize advanced techniques developed to analyze spaceborne nitrogen dioxide (NO2) and sulfur dioxide (SO2)—both short-lived atmospheric trace gases with both anthropogenic and natural sources—datasets. Unfortunately, trends, seasonality, long lifetime, and large atmospheric background significantly complicate the analysis of CO2 hotspots. Our methodology is based on simultaneously deseasonalizing and detrending the data, and then mapping the remaining—the so-called anomaly data—to a grid.

In this paper, we show that the main anthropogenic pollution regions like eastern USA, Central Europe, East Asia, and Middle East are easily detectable from our OCO-2 CO2 anomaly maps. In addition, also smaller sources are visible. In order to better understand CO2 anomaly maps, we simultaneously analyze the established NO2 and SO2 maps—observed by Dutch-Finnish Ozone Monitoring Instrument (OMI) onboard NASA’s Aura spacecraft—and use these data records also to qualitatively validate our results. In future, as the OCO-2 data record gets longer, we hope to individually detect all the Megacities.Keywords: OCO-2, carbon dioxide, anthropogenic emissions, hotspots, validation, OMI, nitrogen dioxide
Subscribe to:
Posts (Atom)
